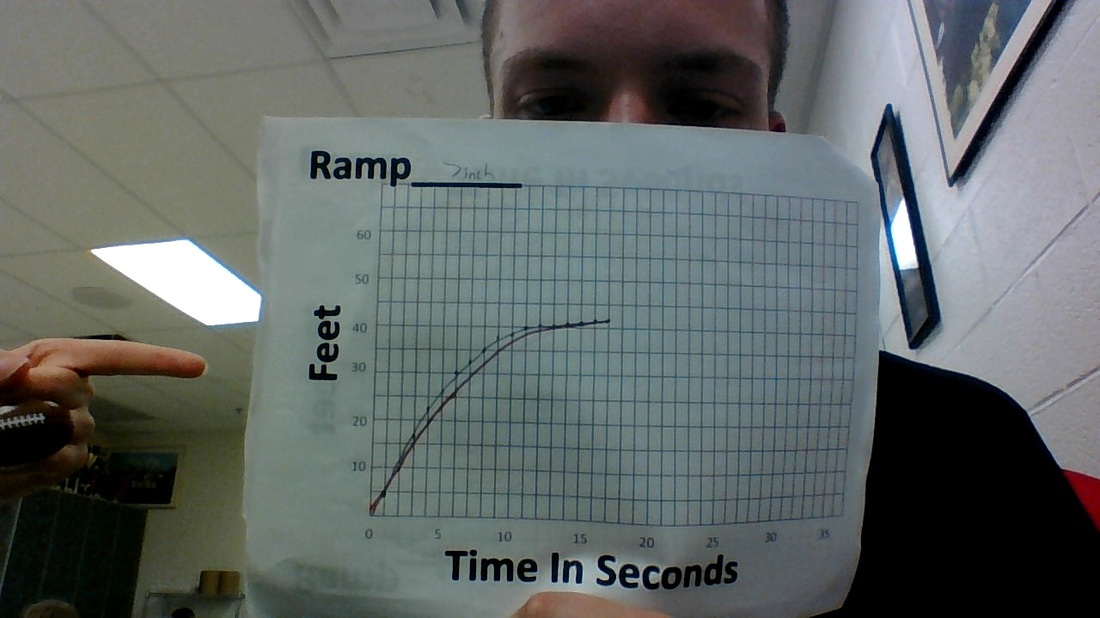
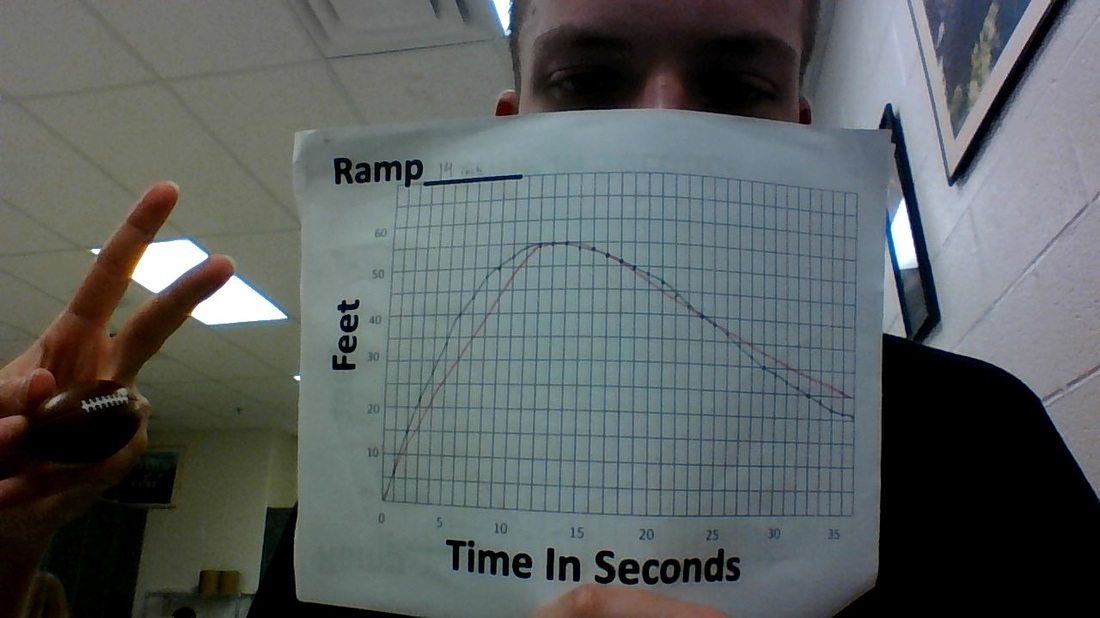
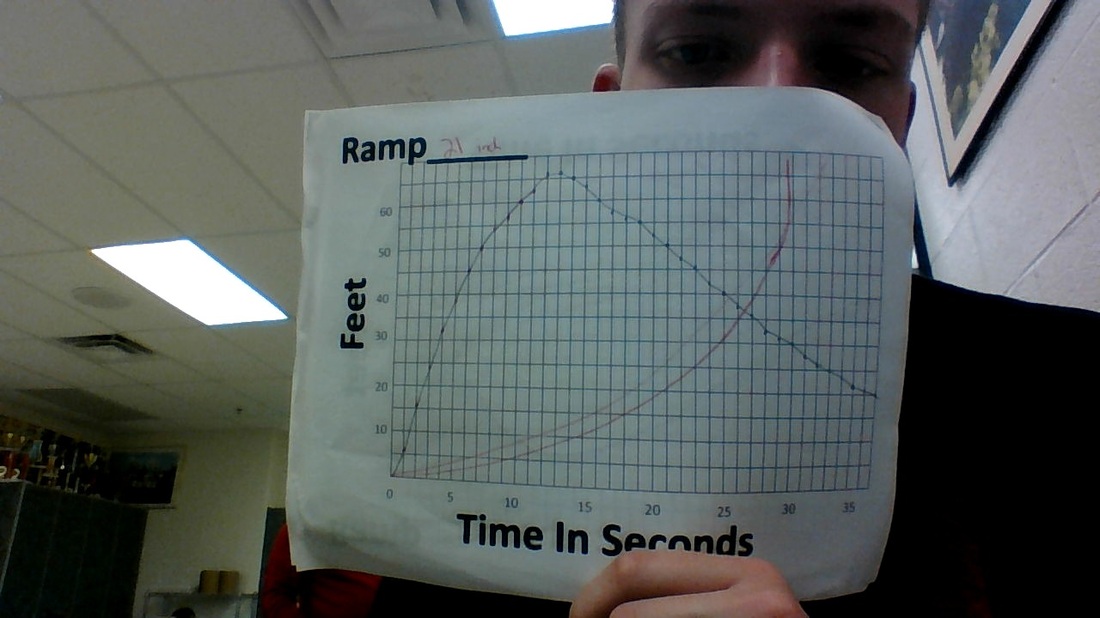
1. My prediction was off by a lot for the 21 inch ramp but for the 7 inch and the 14 inch ramp my predictions were very close and some off the dots were right on. My prediction was off for the 21 inch ramp because it was the first one and i had no clue what to do.
2. For the ramp project the range represents feet and the domain represents time in seconds.
3.What i found was that the higher the ramp was the higher the maximum and the lower the minimum was.
4. When the graph reachest the fastest the skateboard is going the fastest at that point and when the skateboard goes backwards in reachest a fastest point going backwards.
 RSS Feed